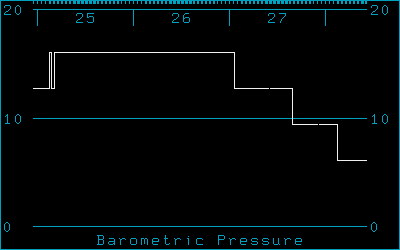

A fascinating aspect of a barograph such as this is that you can often see a regular rhythm of two highs and two lows every twenty-four hours (or a bit less), with one set more extreme than the other. What you are seeing in that case is the effect of the tides on our atmosphere.
Just as tidal forces cause high and low water in our oceans and bays (as we all know well in this area), they also cause high and low air pressure in our atmosphere. Sometimes you can see it in a barograph.
But sometimes you can't. If that's the case right now, and if you're interested, I've saved an example so you can see what I mean.